OEE monitoring measures how much of a line's planned time produces good product at full speed. Overall equipment effectiveness is availability times performance times quality, and on most packaging lines it is lower than anyone expects. The value is not the headline number. It is the breakdown that shows which machine, which stop reason and which shift is costing you output.
You do not need a new line or an expensive software suite to start. Most packaging machines already know when they are running, stopped or faulted. The job is to collect those signals reliably, add the reasons a person knows, and present them so the team acts on them.
The three parts of OEE
| Factor | What it measures | Typical loss on packaging lines |
|---|---|---|
| Availability | Run time as a share of planned time | Changeovers, breakdowns, waiting for materials |
| Performance | Actual speed against ideal speed | Short stops, jams, running slow |
| Quality | Good units as a share of total | Rejects, rework, start-up waste |
The hardest definition to agree is ideal speed. Use the machine's rated speed for the product, not the speed you usually run at. Otherwise you hide the slow-running losses that OEE is meant to reveal.
What to capture from each machine
- Machine state: running, stopped, faulted, starved, blocked, in changeover.
- Good and reject counts, ideally at the bottleneck machine and the end of the line.
- Fault codes from the machine PLC where available.
- Current product or recipe, so performance is judged against the right ideal speed.
- Downtime reason entered by the operator for stops longer than a set threshold.
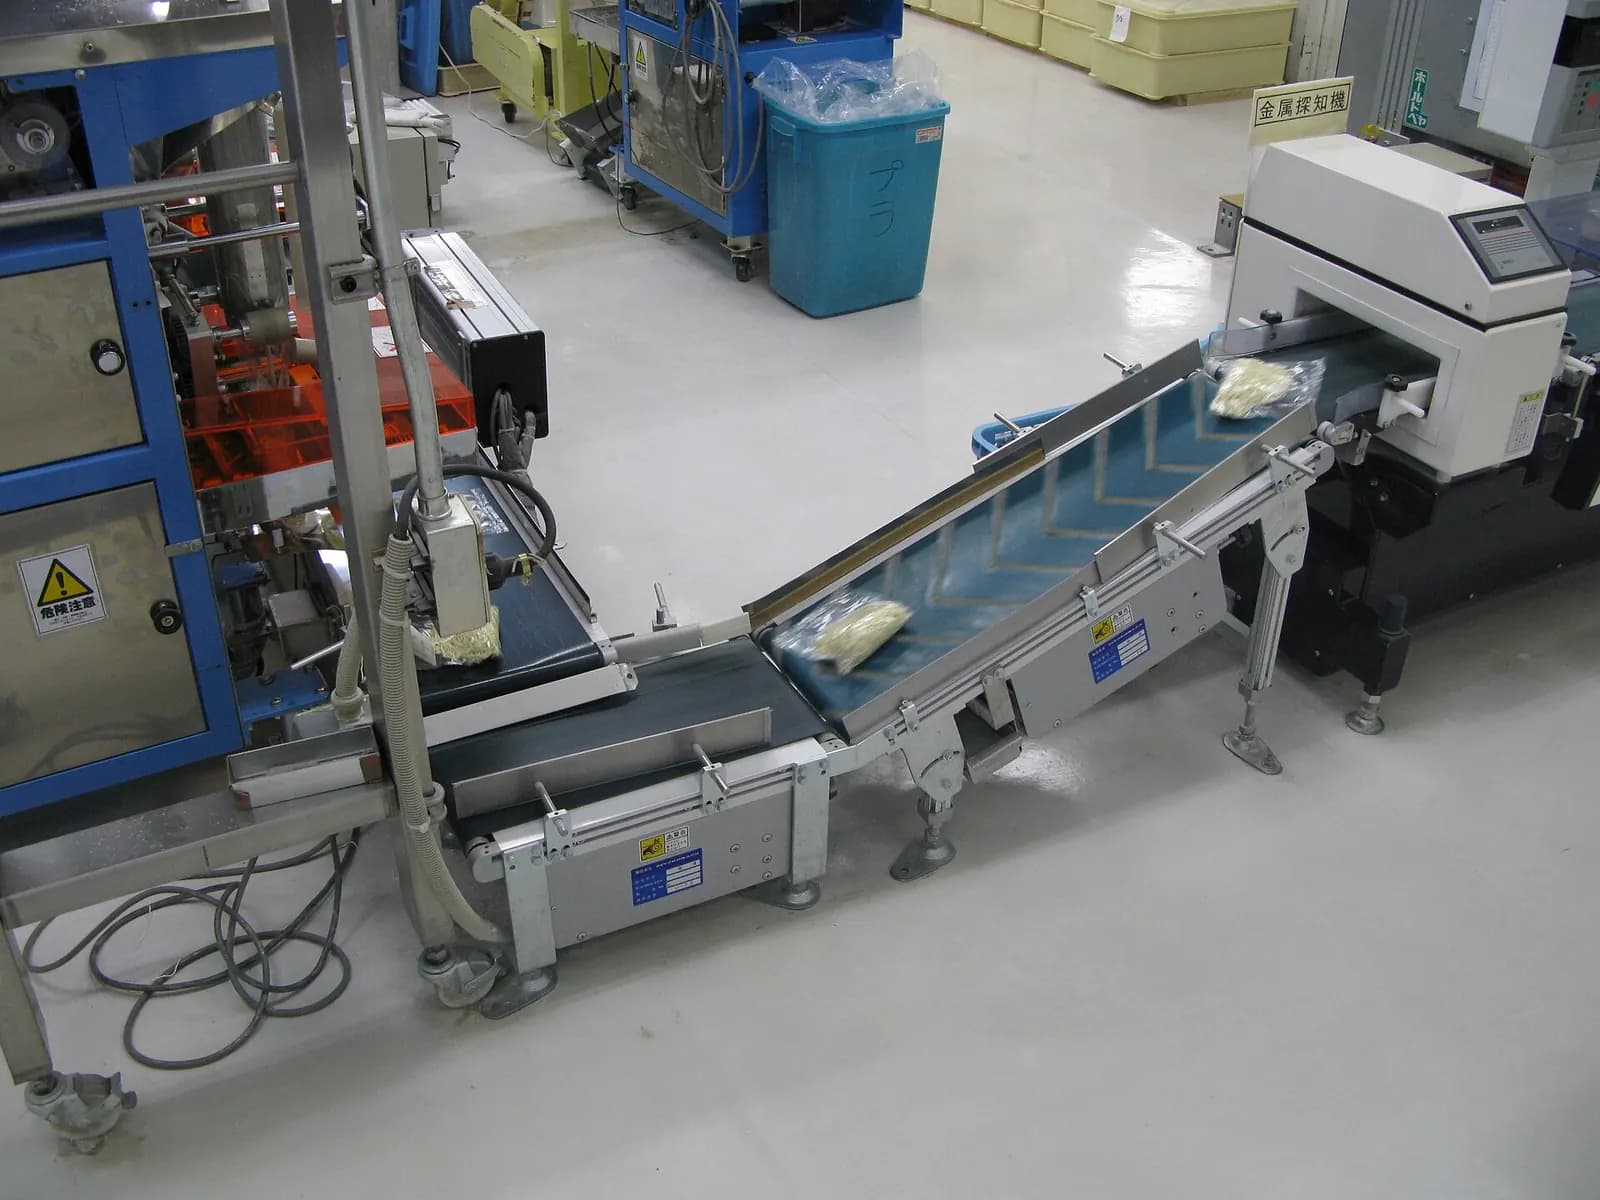
Connecting older machines
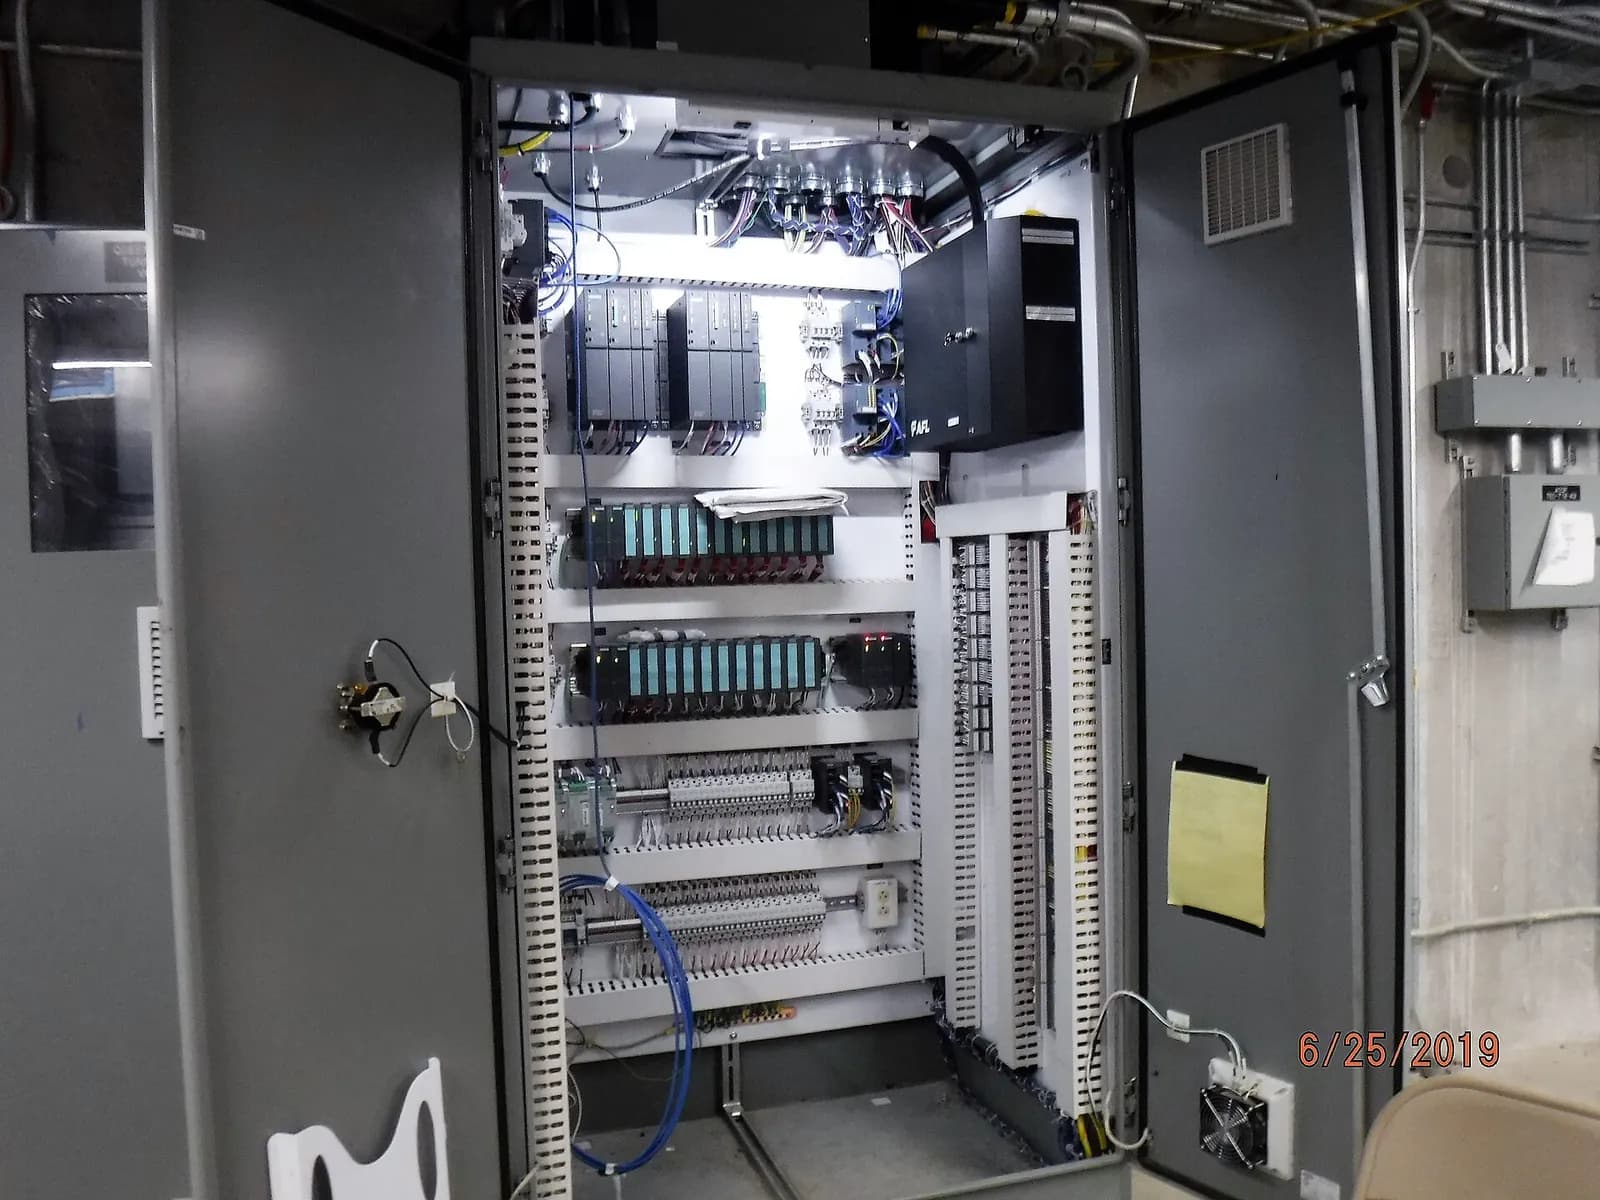
Newer machines often expose data over OPC UA or a fieldbus. The OPC Foundation describes OPC UA as a platform-independent architecture with built-in security and information modelling, with more than 150 companion specifications for different industries. Older machines may offer only a few spare PLC outputs or none at all. In that case, a small I/O module reading the run lamp, fault lamp and a product sensor can give you most of what you need.
For moving data from the line to a dashboard, many sites use a lightweight publish and subscribe protocol such as MQTT, often alongside OPC UA at the machine level. Choose whatever your IT and maintenance teams can support. Simple and reliable beats clever.
What Is MQTT and How It Works
RealPars
This video is hosted on YouTube. Playing it loads content from Google, which may set cookies.
Watch on YouTubePackML: a common language for machine states
If you buy new packaging machines, ask for PackML. OMAC's PackML standard, adopted by ISA as ISA-TR88.00.02, gives machines from different suppliers consistent behaviour and makes machine data easier to collect. With PackML, every machine on the line reports states in the same way, so the OEE system does not need custom logic for each one.
Downtime reasons: keep the list short
The most common failure of OEE projects is a reason-code list with eighty entries that operators ignore. Start with ten or twelve reasons that match how the team already talks about stops, and only ask for a reason on stops longer than a few minutes. Short stops are better captured automatically from machine states and fault codes.
Turning data into improvement
- Review the top three losses at a short daily meeting, not a monthly report.
- Assign one owner per loss and track actions on the same screen as the data.
- Check the bottleneck machine first: improving any other machine rarely raises line output.
- Re-baseline after each change so the team can see the result of its work.
Calculate it the same way everywhere
OEE numbers are only comparable if every line uses the same rules. Decide once whether planned cleaning counts against availability, whether changeovers are planned time, which machine's count defines line output, and what the ideal rate is for each product. Write the rules down and build them into the system rather than a spreadsheet, so a new shift manager cannot quietly change the definition. Many sites track both OEE and a simpler measure, such as cases per planned hour, which operators find easier to relate to.
Expect the first figures to be uncomfortable. When manual records are replaced with machine data, OEE usually drops, because short stops and slow running that were never written down now appear. That is the system working, not the line getting worse.
Short stops: the hidden loss
On packaging lines the largest single loss is often short stops: a carton that jams, a label that fails to apply, a sensor that sees a gap. Each lasts seconds, nobody records it, and together they can cost more than every breakdown in the month. Capture them automatically from machine states, count them by fault code and fix the top one first. The fix is often mechanical, such as a guide rail or a sensor bracket, rather than a control change.
Funding and next phases
Machine data capture is a common Made Smarter project, and match-funded grants of up to £20,000 are available in most English regions. See our Made Smarter grant guide. Once the data is flowing, it also becomes the basis for a line digital twin; our virtual commissioning article shows where that leads.
Next step
Send us a list of the machines on one line with their PLC types. We will propose a data capture design and dashboard scope through our automation engineering service, or contact us to discuss your line.